Insights
Insights Hub is the mission control room for your Tray organisation, surfacing analytics and operational insights into the health and performance of your assets
The length of insights period you have depends on your package:
- Pro = 7 days
- Team = 30 days (180 as optional add-on)
- Enterprise = 180 days
Insights Hub is the mission control room for your Tray organisation, surfacing analytics and operational insights into the health and performance of your assets, providing transparency into the delivery of your integrations and their adoption, and helping identify issues for timely remediation using near real-time metrics.
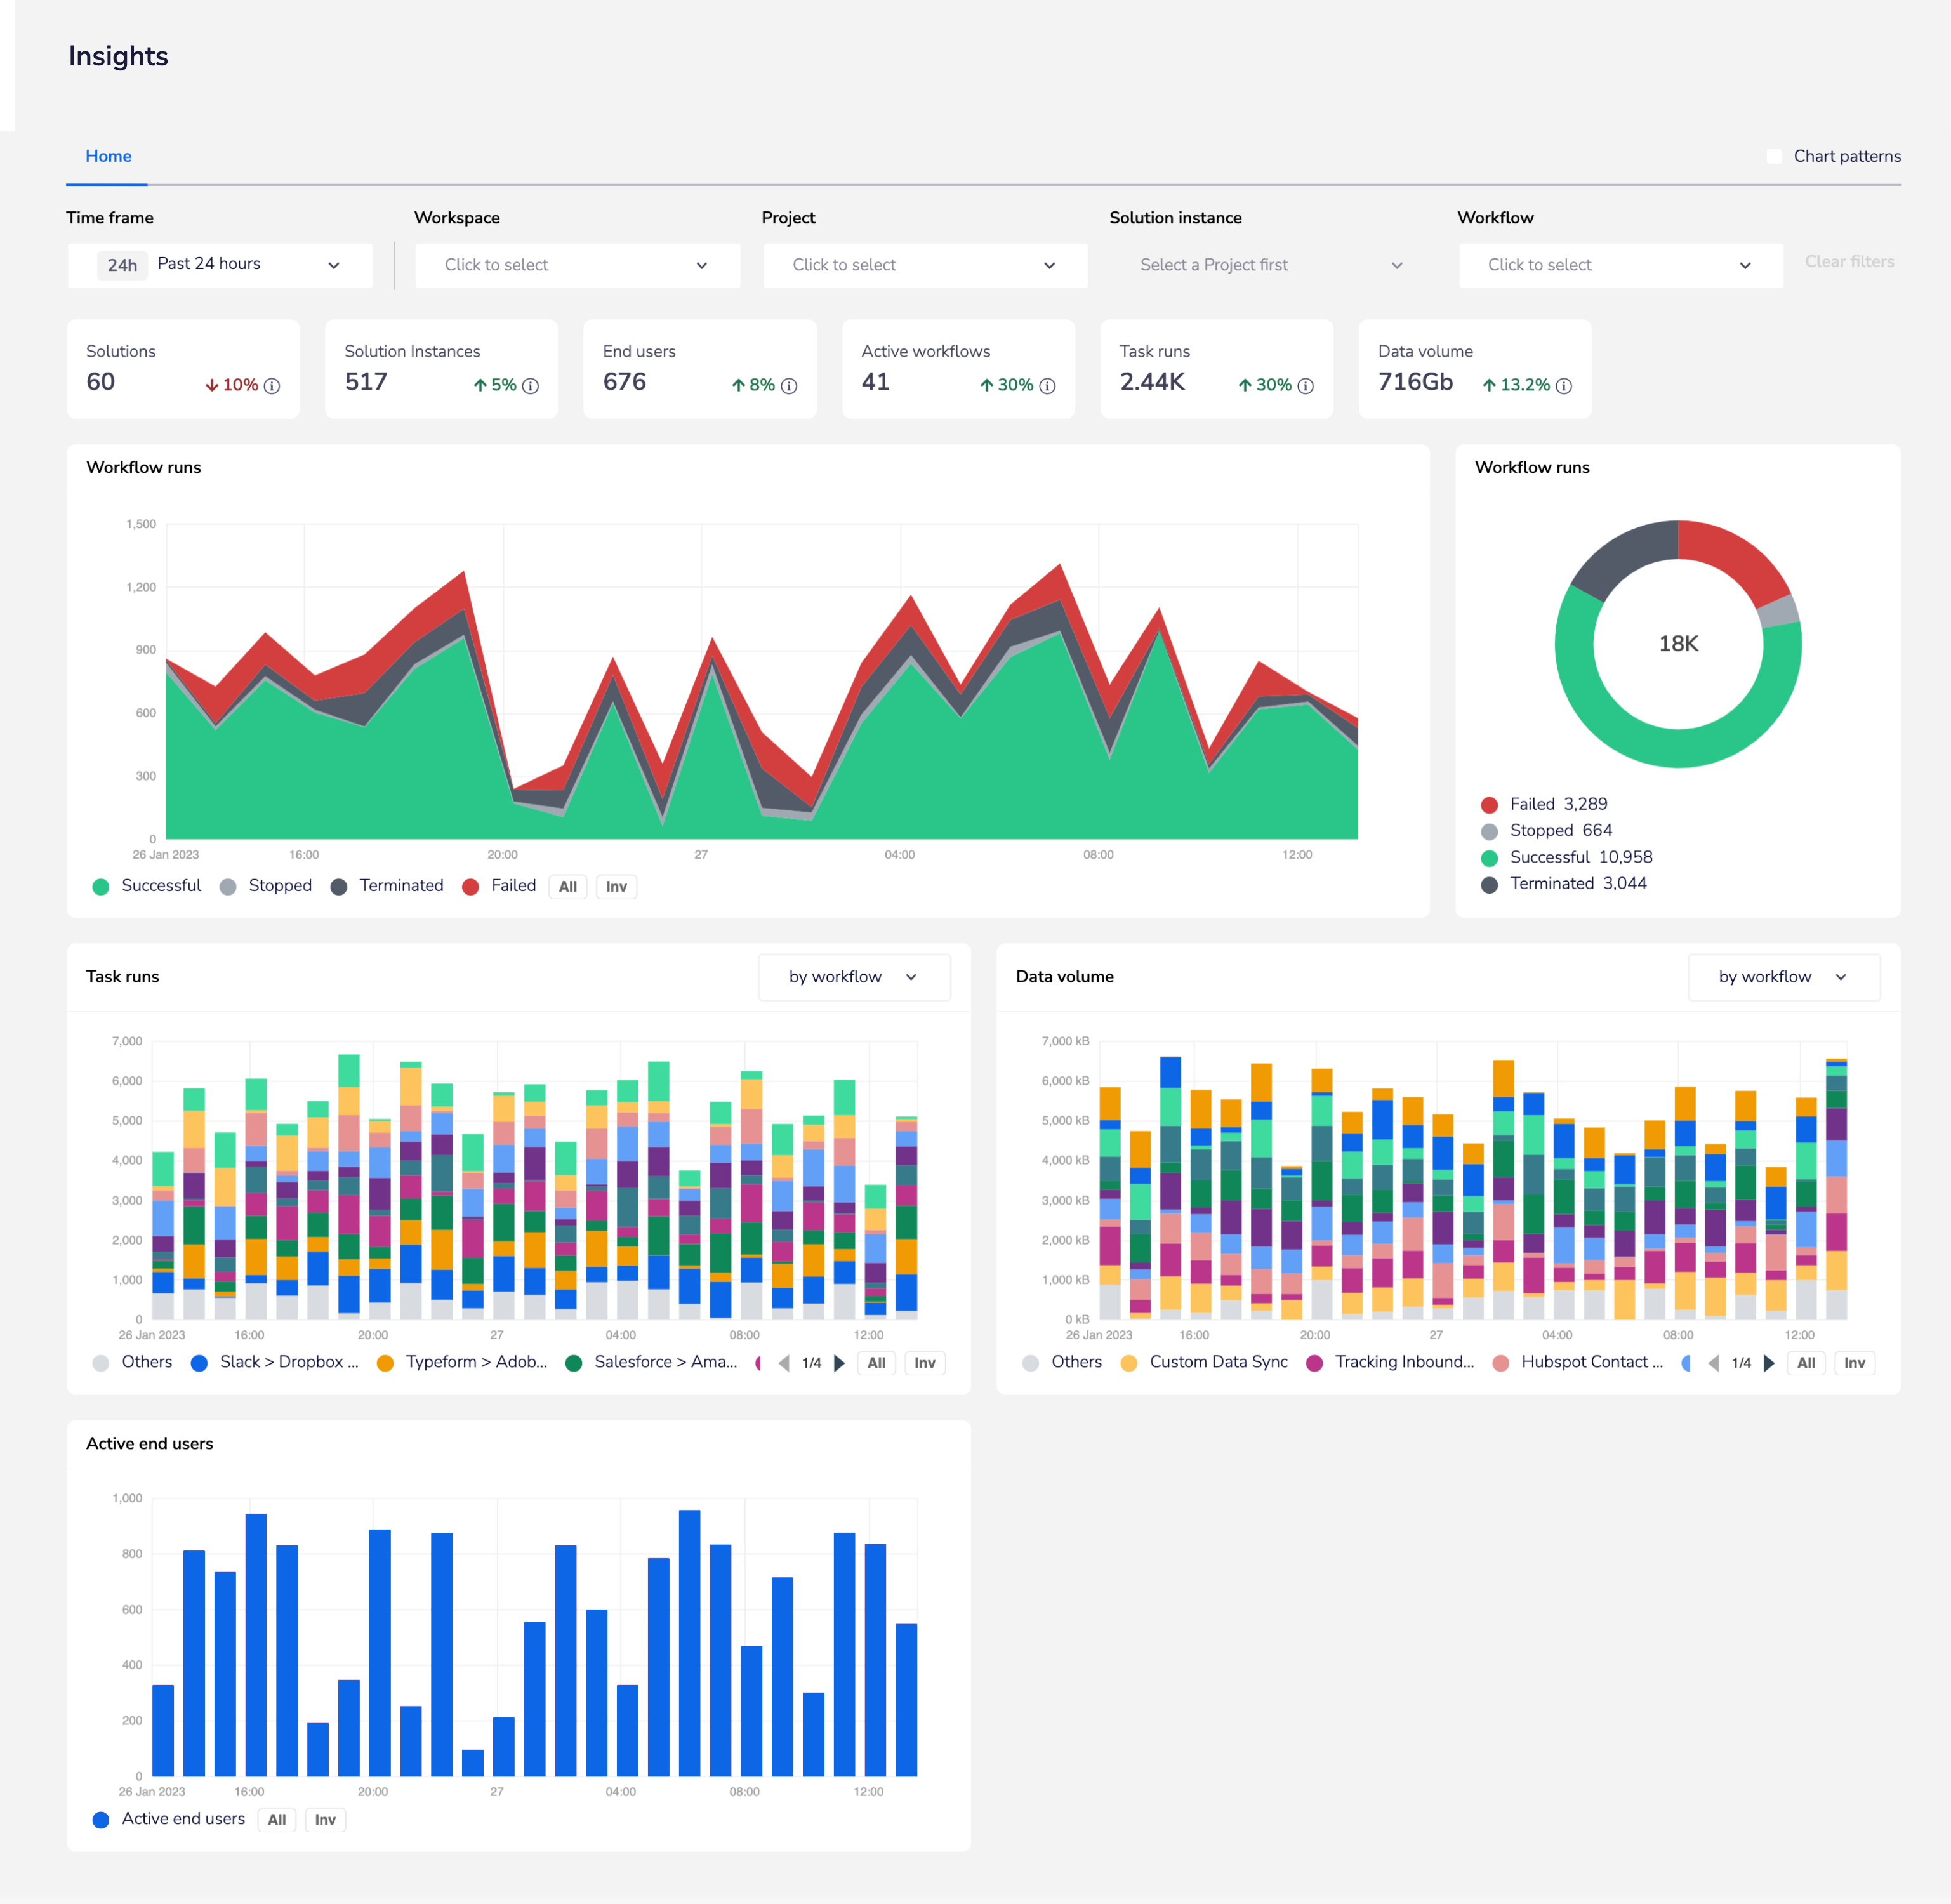
You can find the Insights Hub by selecting Insights from the main menu in the dashboard in your organisation:
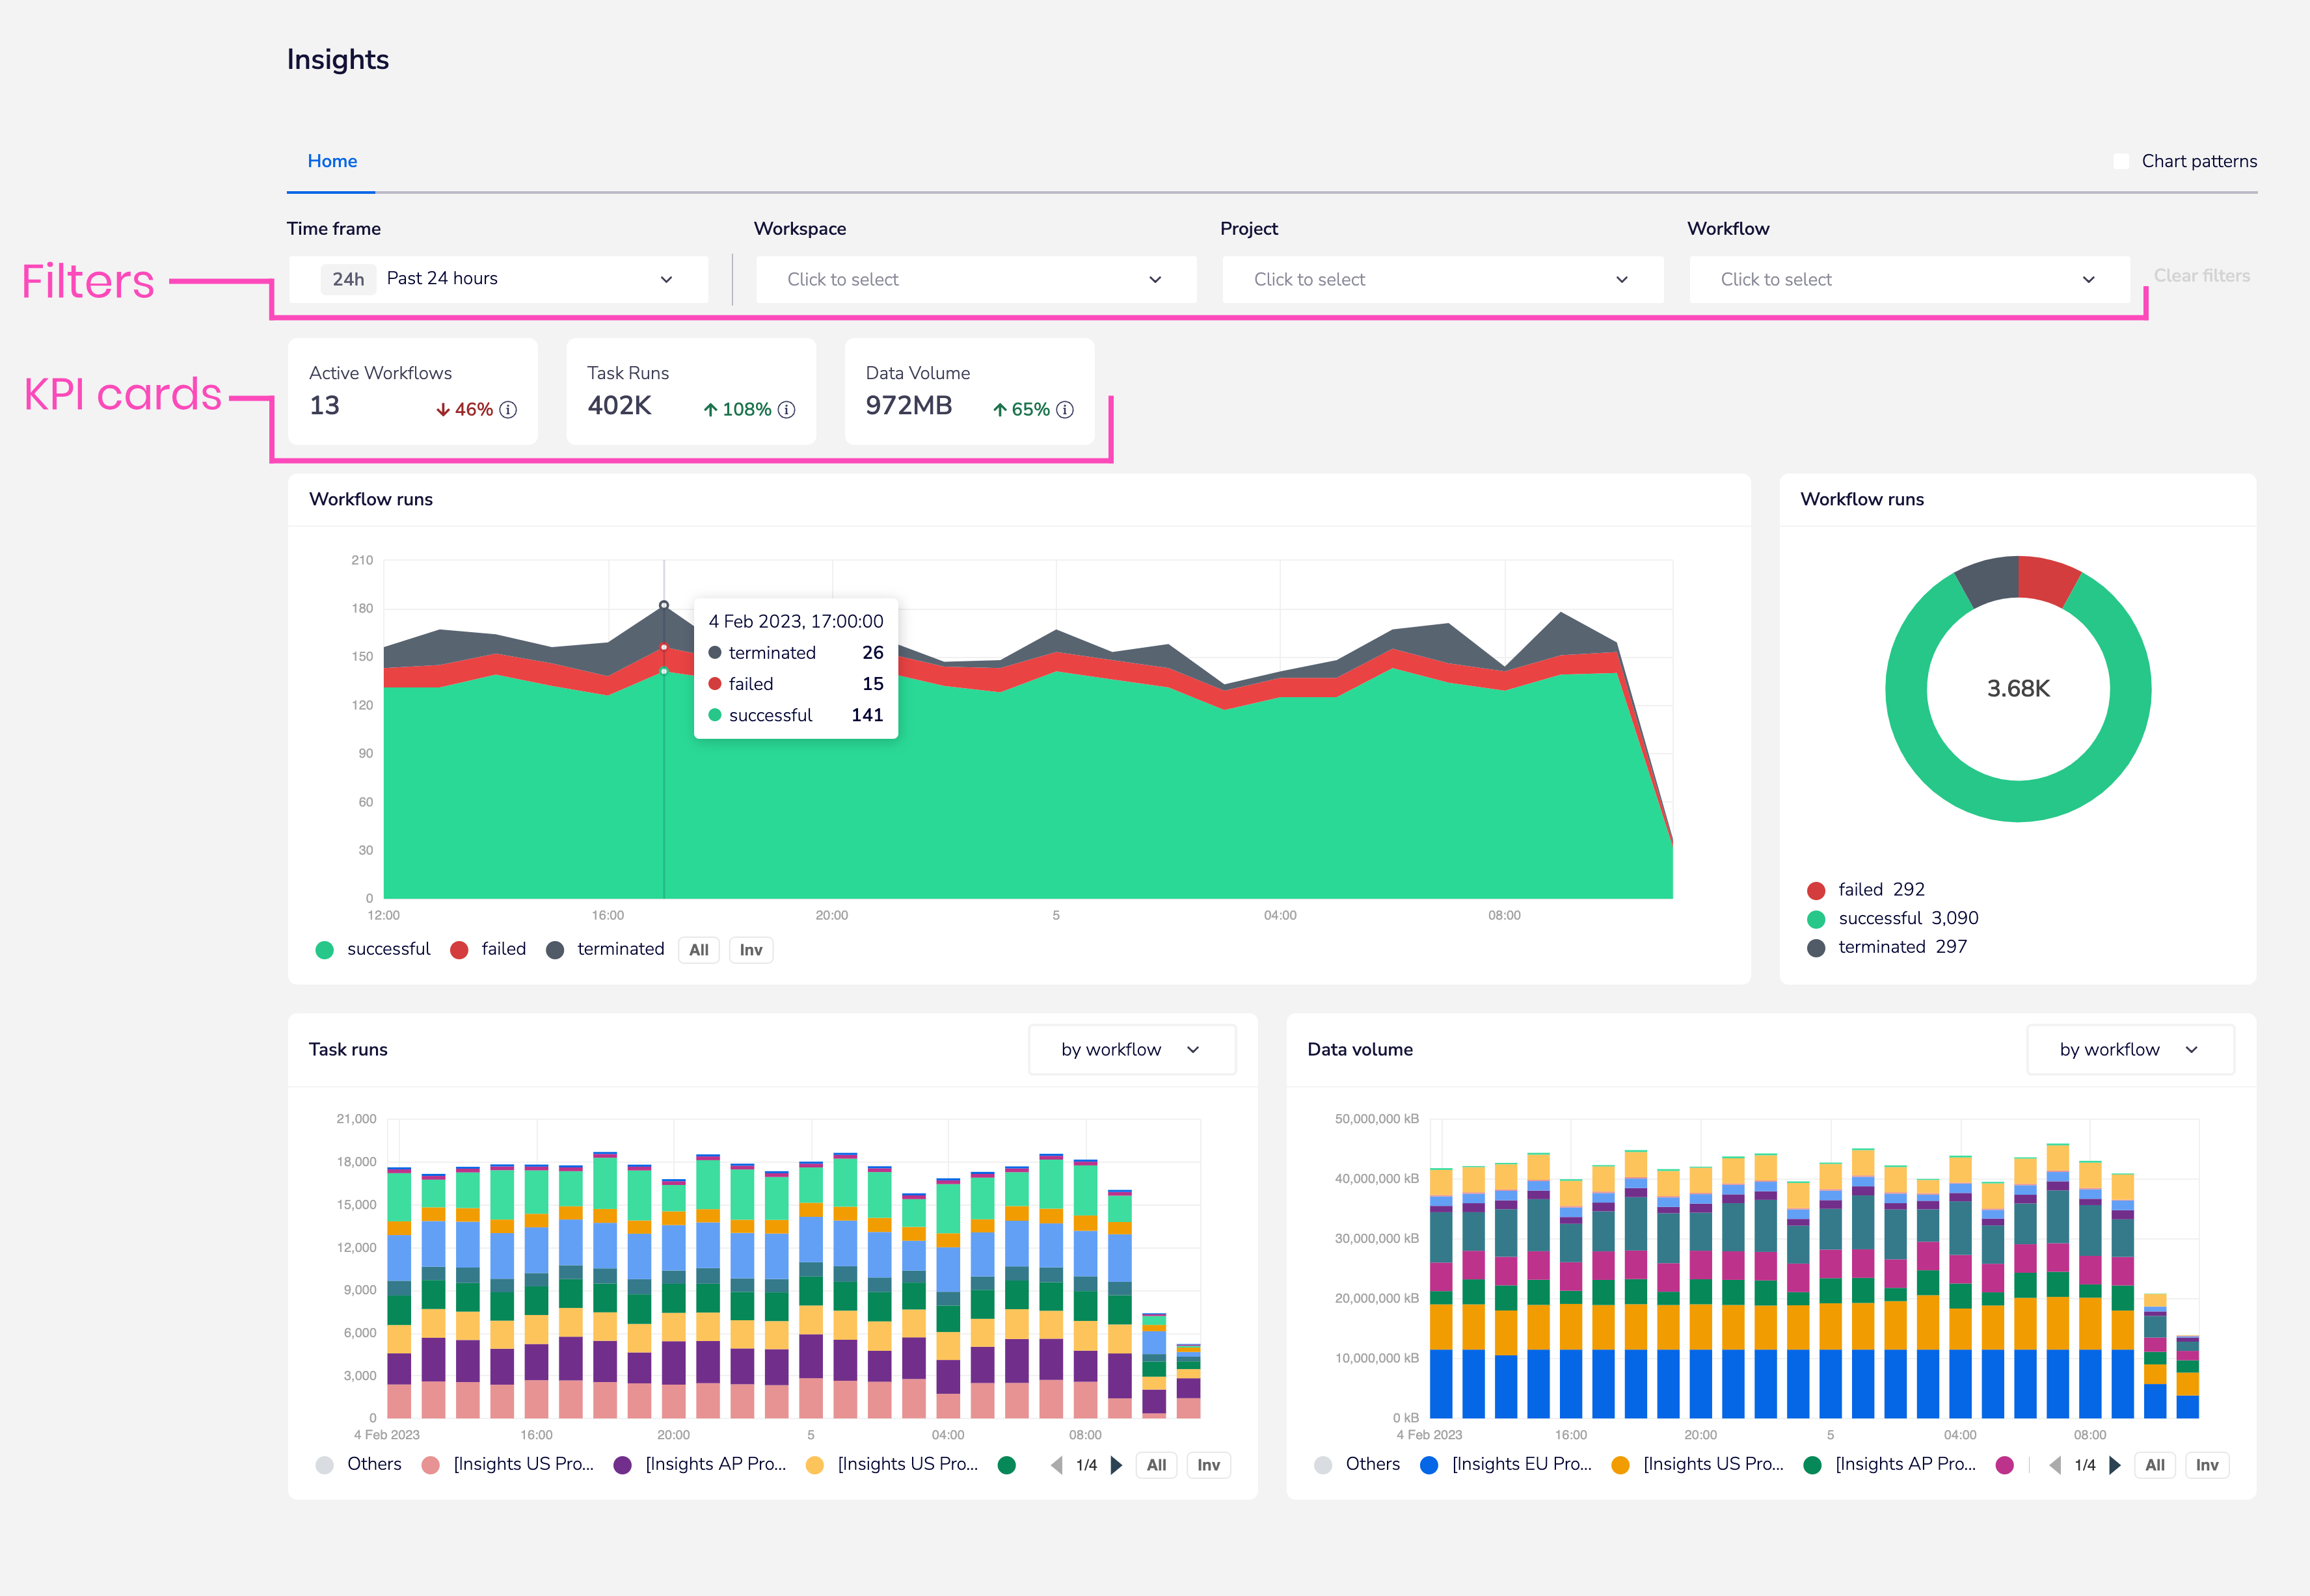
Filtering and KPI cards
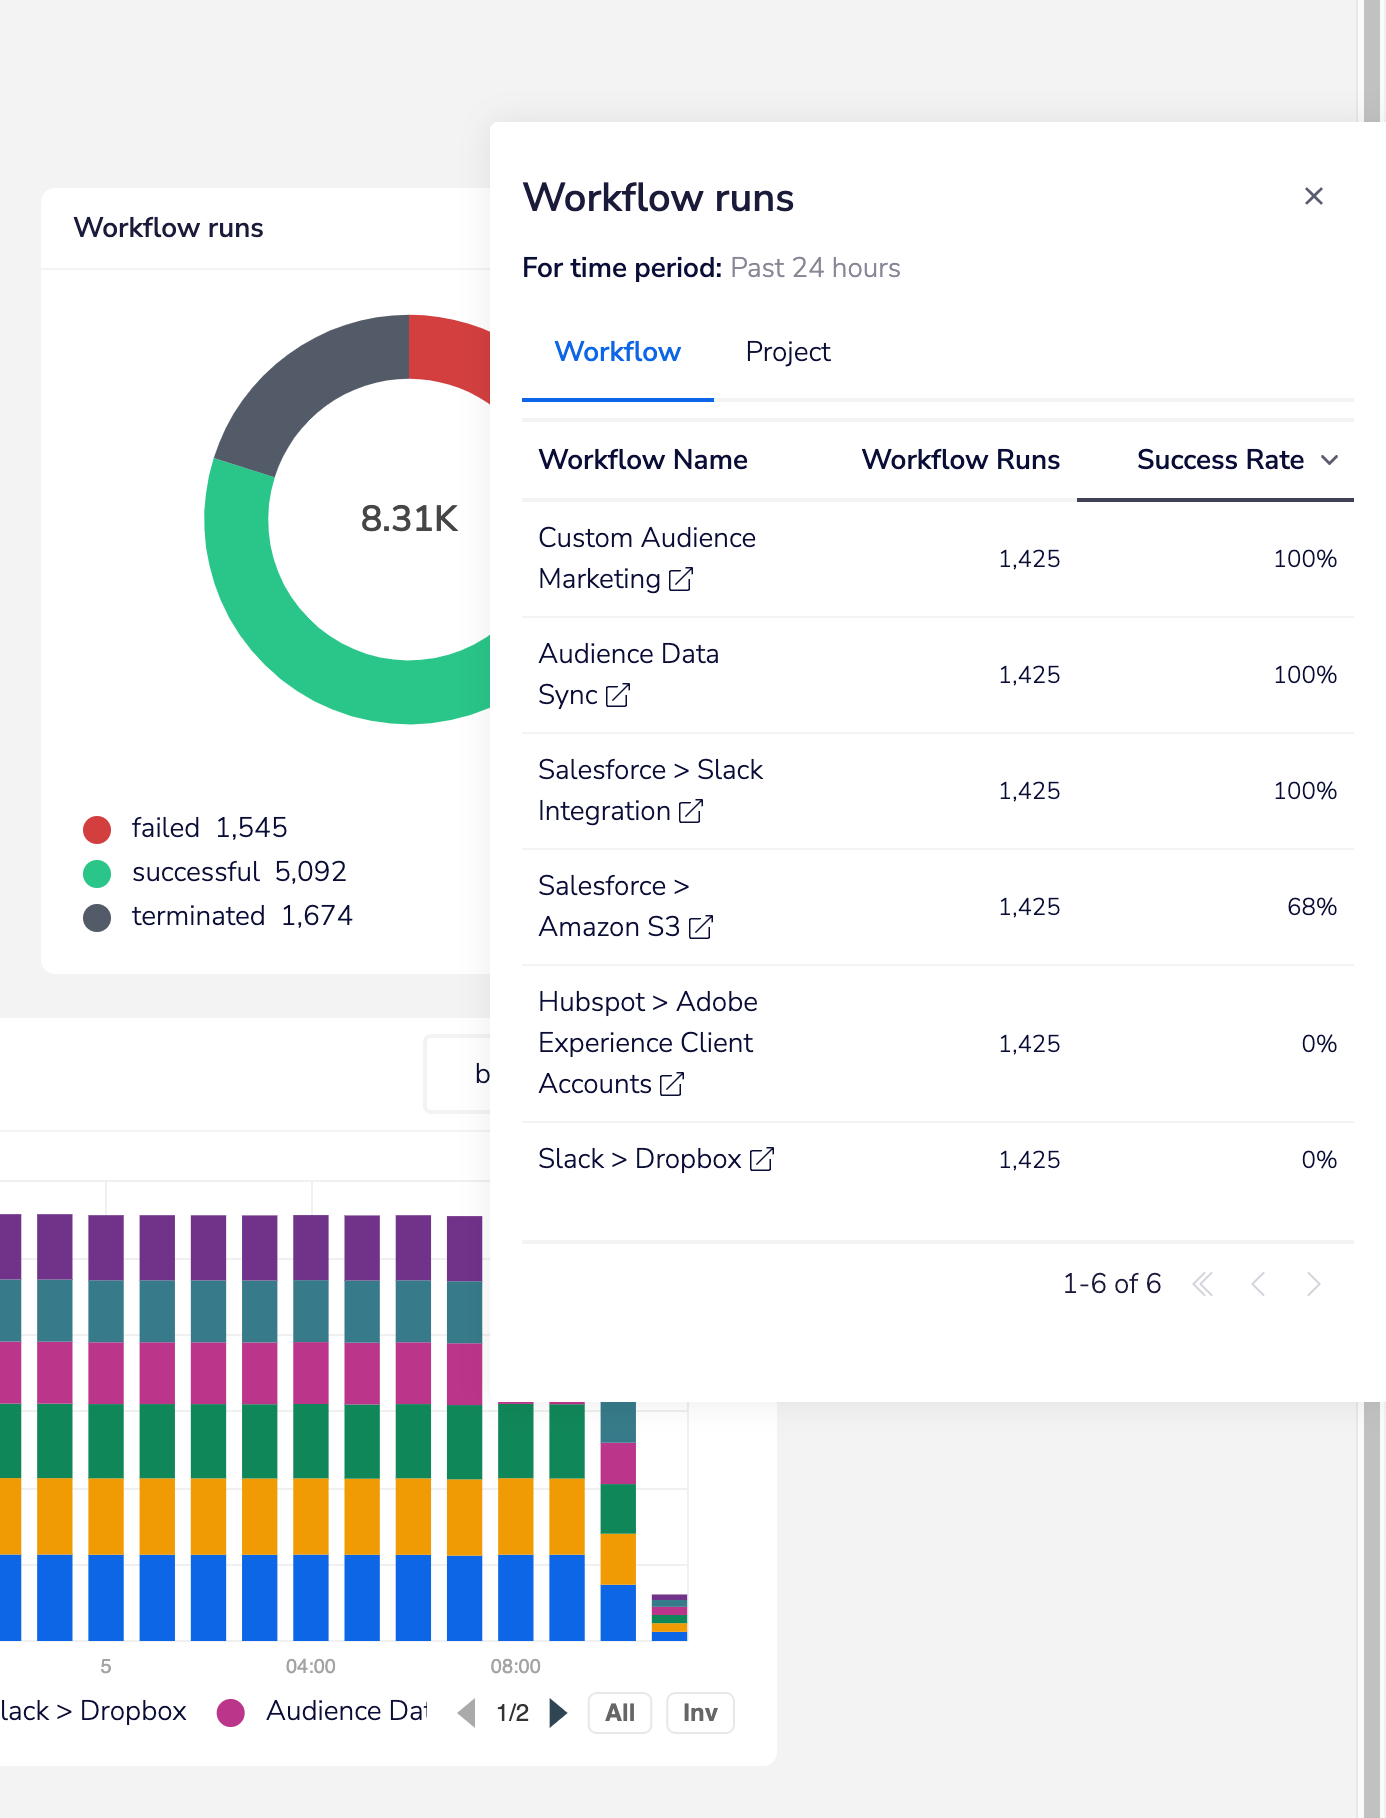
Workflow runs data
Clicking on the successful / failed / terminated sections of either the main workflow runs chart or the donut chart will open up the 'drawer' view of workflows over the selected time period.
A powerful feature is that you can click on the link to go directly to the workflow itself to debug any issues:
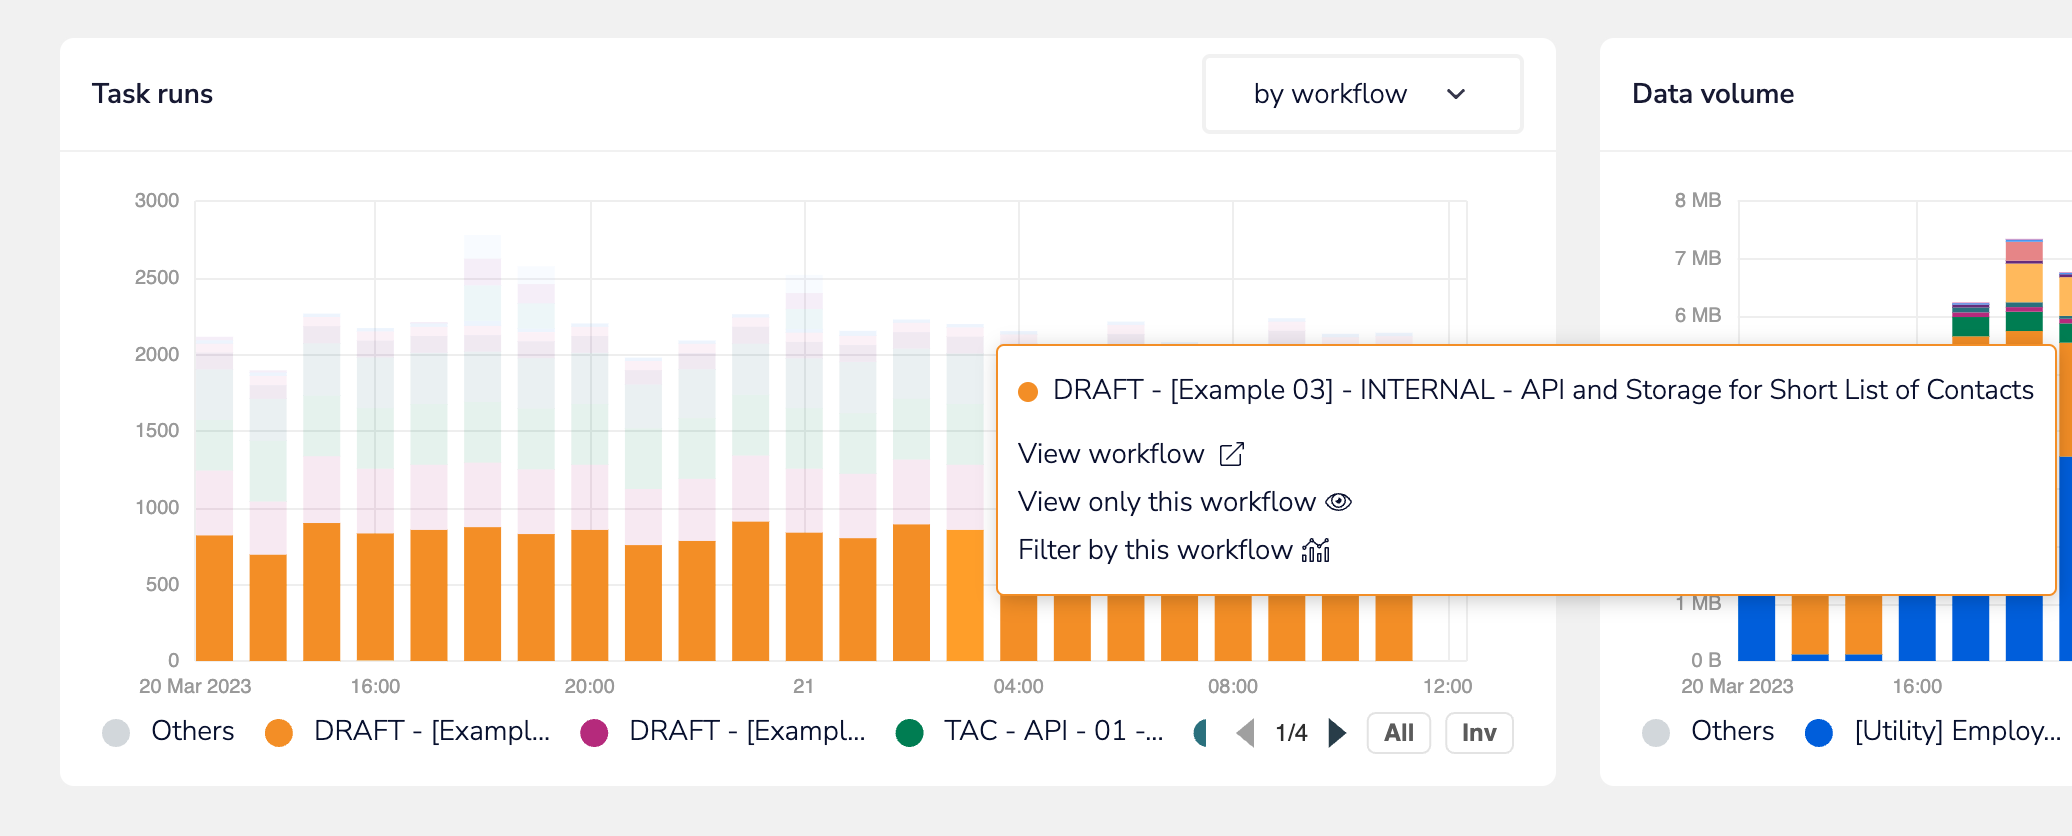
Task runs
The task runs chart also gives you the ability to view workflows which are running the most amount of tasks.
Again, you can easily access the workflow directly by clicking the provided link:
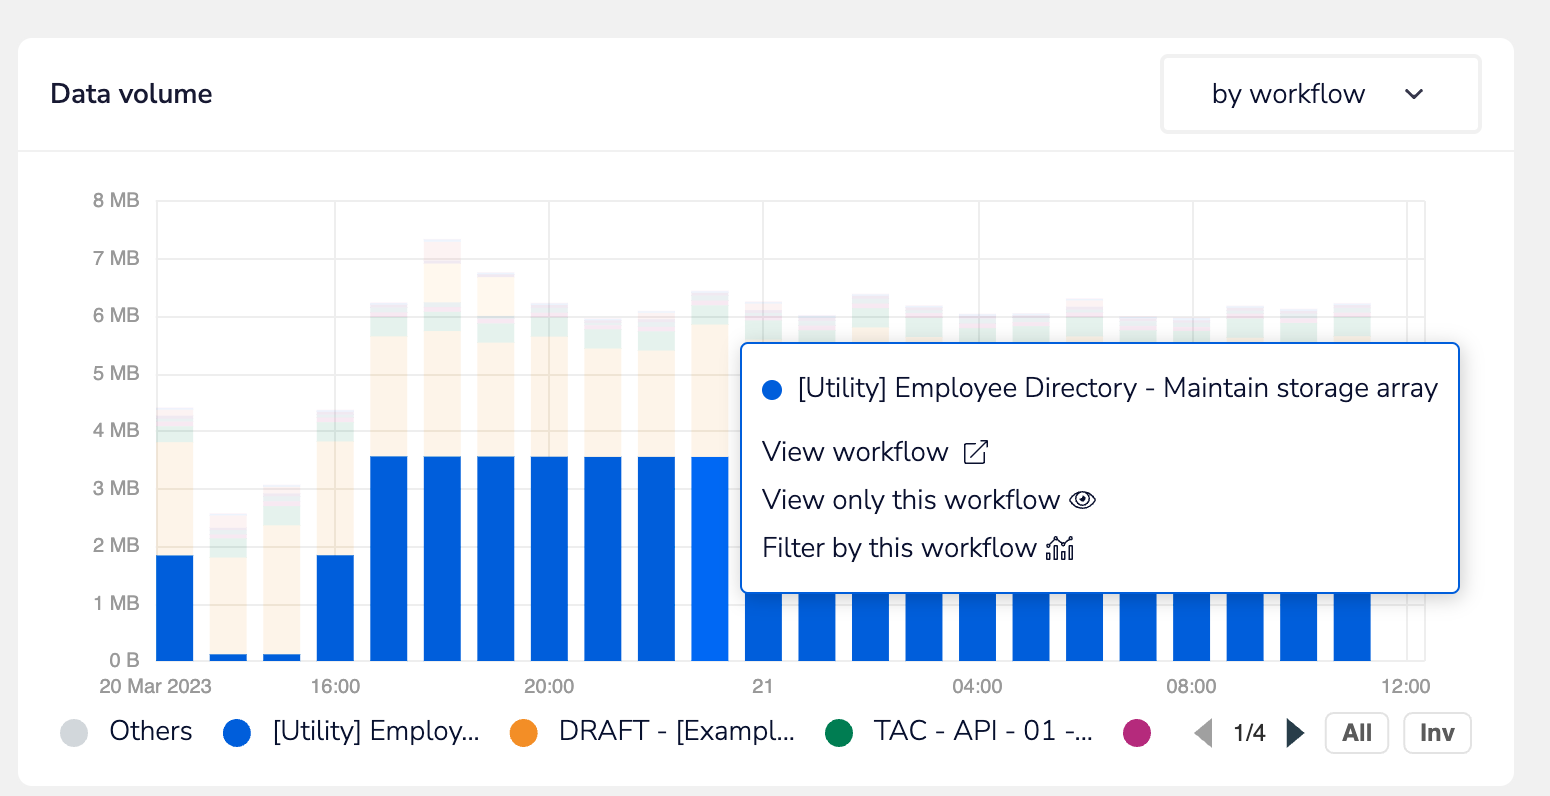
Data volume
The data volume chart works in the same way as task runs - helping you to pinpoint workflows and projects with the largest throughput of data:
Embedded view
Embedded customers can get a view on their Solution Instances and can drill down into the source workflows and End User-specific workflow instances to troubleshoot all aspects of their integrations: